Mean / Median / Mode Calculator
Calculatorsera.com
7 Amazing Ways a Mean / Median / Mode Calculator Can Simplify Your Life
When it comes to numbers, averages can be confusing. You might have heard the words mean, median, and mode in school, but do you know what they really mean and why they matter in everyday life? Don’t worry — by the end of this article, you’ll understand everything in a simple, fun way, and you’ll see how a Mean / Median / Mode Calculator can make life so much easier.
The Mean / Median / Mode Calculator serves as an invaluable tool for simplifying the analysis of numerical data. By providing precise calculations of the mean, median, and mode, users can gain clearer insights into datasets, enhancing their decision-making processes. The incorporation of this calculator can eliminate confusion surrounding statistical terms, thus fostering a better understanding of data interpretation. As a result, individuals can effectively leverage this tool to streamline their analytical tasks and draw meaningful conclusions from their data.
Table of Contents
Introduction: Understanding Mean, Median, and Mode

Numbers are everywhere — in school, at work, and even in your personal life. Knowing how to find averages can help you make smart decisions, like checking your test scores, planning a budget, or tracking your health progress.
Mean, median, and mode are three different ways to find an average. Each one tells a slightly different story about your numbers. The good news? You don’t need to be a math expert to use them. With a simple mean median mode calculator, you can get accurate results instantly.
Here’s a friendly way to understand these three important averages:
- Mean (average): The sum of all numbers divided by how many numbers there are.
- Median (middle number): The number in the middle when all numbers are arranged in order.
- Mode (most frequent number): The number that appears most often.
Why Average Calculations Matter in Everyday Life
Knowing averages isn’t just for math class. Think about these examples:
- Checking your grades to see how well you’re doing.
- Tracking weight loss or fitness progress over time.
- Managing monthly expenses to save money.
- Calculating business profits to plan for growth.
In each case, understanding your numbers with a statistics calculator makes decisions simpler and smarter.
What is a Mean / Median / Mode Calculator?
A Mean / Median / Mode Calculator is an online tool designed to quickly calculate these three types of averages. Instead of adding numbers and dividing manually, you can simply enter your list of numbers and get instant results.
It’s especially useful when dealing with large numbers, multiple entries, or when you want to avoid mistakes.
How Each Average Works (Explained Simply)
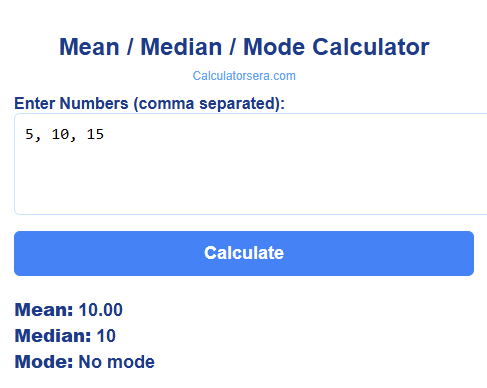
Mean (Average)
The mean is what most people think of as the “average.” You add up all your numbers, then divide by how many numbers there are.
Example:
Numbers: 5, 10, 15
Mean = (5 + 10 + 15) ÷ 3 = 30 ÷ 3 = 10
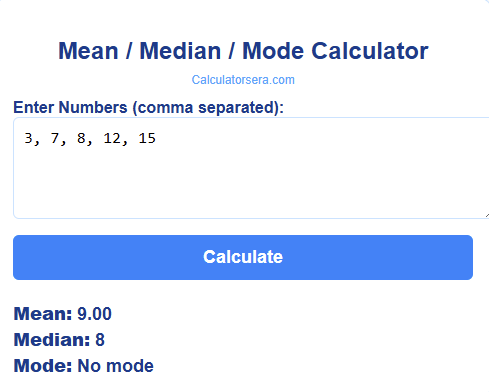
Median (Middle Number)
The median is the middle number in a list. Arrange your numbers from smallest to largest and pick the one in the middle. If there’s an even number of numbers, the median is the average of the two middle numbers.
Example:
Numbers: 3, 7, 8, 12, 15
Median = 8
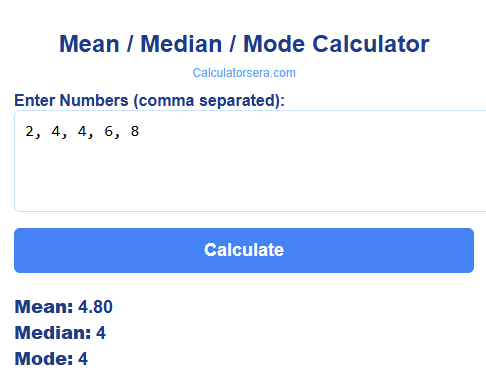
Mode (Most Frequent Number)
The mode is the number that appears most often in your list.
Example:
Numbers: 2, 4, 4, 6, 8
Mode = 4
Why People Need This Calculator
A mean median mode calculator is helpful for many reasons:
1. Education and Homework
Students can quickly solve math problems and check their answers without confusion.
2. Business and Finance
Business owners use it to calculate average sales, expenses, and profits.
3. Research and Surveys
Researchers analyze data sets to find trends and patterns.
4. Personal Tracking
Whether it’s scores, weights, or money spent, tracking averages helps you make informed decisions.
How the Calculator Works Step-by-Step
Using a mean median mode calculator is easy:
- Input your numbers: Type or paste your list of numbers separated by commas.
- Click calculate: The tool instantly calculates mean, median, and mode.
- View your results: Get instant results for all three averages.
Example:
Numbers: 5, 8, 10, 10, 12
- Mean = 9
- Median = 10
- Mode = 10
Types of Calculations Explained
How to Calculate Mean Manually
Step 1: Add all numbers together.
Step 2: Count how many numbers there are.
Step 3: Divide the total sum by the number of numbers.
Example:
Numbers: 6, 9, 12
Mean = (6 + 9 + 12) ÷ 3 = 27 ÷ 3 = 9
How to Calculate Median Manually
Step 1: Arrange numbers in order.
Step 2: Pick the middle number. If even, average the two middle numbers.
Example:
Numbers: 3, 8, 12, 20
Median = (8 + 12) ÷ 2 = 10
How to Calculate Mode Manually
Step 1: Count how many times each number appears.
Step 2: The number with the highest count is the mode.
Example:
Numbers: 1, 4, 4, 5, 6
Mode = 4
Where Mean, Median, Mode Are Used
- School and College Assignments: Solving math problems and analyzing scores.
- Data Analysis: Finding trends in numbers.
- Sports Statistics: Calculating average scores or player performance.
- Business Profit Tracking: Checking average revenue.
- Budgeting and Financial Planning: Monitoring monthly expenses.
- Health and Fitness Progress: Tracking weight or exercise results.
- Surveys and Polls: Understanding public opinions.
- Market Research: Analyzing sales and customer behavior.
Manual Method Examples
Small Number Set Example
Numbers: 2, 4, 6, 8, 10
- Mean = 6
- Median = 6
- Mode = No mode (all numbers are unique)
Large Number Set Example
Numbers: 10, 15, 20, 15, 25, 30, 15
- Mean = (10 + 15 + 20 + 15 + 25 + 30 + 15) ÷ 7 = 130 ÷ 7 ≈ 18.57
- Median = 15
- Mode = 15
Real-Life Situation Example
Money spent per week: 20, 30, 25, 30, 40
- Mean = 145 ÷ 5 = 29
- Median = 30
- Mode = 30
Benefits of Using a Calculator
- Saves time: No need to calculate manually.
- Mistake-free: Avoids errors when working with many numbers.
- Helps students understand concepts: Visualizes averages instantly.
- Removes confusion: Calculates all three averages at once.
- Useful for teachers, business owners, and analysts: Reliable for reports and analysis.
Manual Method vs Calculator Method Comparison
| Method | Accuracy | Speed | Difficulty | Best Use Case |
|---|---|---|---|---|
| Manual | High (if careful) | Slow | Medium to High | Small number sets, learning purposes |
| Calculator | Very High | Instant | Easy | Large number sets, quick analysis |
Visual Chart
Mean, Median, Mode Visualization
Understanding Your Numbers Visually
Numbers on a page can be hard to understand at a glance. That’s why visual charts are so powerful. When you calculate the mean, median, and mode of a dataset, you can see trends more clearly through a chart. For instance, a bar chart lets you instantly spot the average (mean), the middle value (median), and the most common number (mode).
Imagine you’re a student tracking your weekly quiz scores: 5, 8, 10, 10, 12. By looking at the bar chart above:
- You see the mean at 9 — representing your average performance.
- The median at 10 shows that half your scores are above and half below this number.
- The mode at 10 highlights your most frequent score, letting you know where you usually perform.
Charts turn numbers into a story you can see instantly. Instead of scanning lists or doing manual calculations, you get a clear visual summary.
Why Visualizing Mean, Median, and Mode Matters
- Instant Understanding:
Bar charts or graphs make comparisons fast. You can immediately see if your average score is close to your most frequent score or the middle value. - Spot Trends Easily:
Suppose your scores over time are 5, 8, 10, 10, 12, 15, 18. Using a chart, you can see improvement trends at a glance. - Decision Making:
Businesses can use visual charts for profit, sales, or survey data. Seeing the mean, median, and mode helps identify what’s typical, what’s extreme, and what occurs most frequently. - Learning Tool:
Students can combine numbers and visual charts to understand statistical concepts faster. Seeing how the mean, median, and mode differ helps reinforce learning.
Real-Life Applications of Charts
1. School and Education:
Teachers can show class performance using charts. Students can compare their scores to the class mean or median and see which scores are most common.
2. Business & Finance:
Companies track sales, expenses, or profits. For example, if weekly sales are 200, 250, 250, 300, and 400 units, a chart shows:
- Mean sales: 280 units
- Median: 250 units
- Mode: 250 units
This allows managers to plan stock and understand customer patterns visually.
3. Health & Fitness:
Track weekly running distances: 3, 5, 5, 6, 8 km. The chart helps you see your average performance, your middle distance, and your most common distance, helping you set realistic fitness goals.
4. Surveys & Polls:
If a survey asks 100 people their favorite fruit and you have counts like 20, 30, 30, 15, 5, a bar chart shows instantly:
- Mean votes per fruit
- Median count
- Most popular fruit
How to Use This Chart With Your Calculator
The beauty of combining a Mean / Median / Mode Calculator with a chart is that you get both accuracy and clarity:
- Enter your numbers into the calculator.
- Copy the calculated mean, median, and mode values.
- Paste them into the chart’s
dataarray. - Your visual bar chart instantly updates to show results.
This method is especially useful when you have large datasets. Humans can make errors calculating 50+ numbers manually, but a chart + calculator combo removes mistakes and makes trends obvious.
Explaining the Differences With the Chart
A chart also highlights differences between mean, median, and mode:
- If all values are equal, the three bars line up.
- If there’s an extreme value, the mean bar shifts, while the median and mode may remain closer together.
- You can visually understand why median is sometimes preferred in real-world data, like income or housing prices.
Frequently Asked Questions
What is the easiest way to find mean, median, and mode?
Using a mean median mode calculator is the easiest way. You simply input your numbers and get instant results without mistakes.
What is the formula for calculating the mean?
Add all the numbers together and divide by how many numbers there are.
How do I calculate median quickly?
Sort your numbers in order and find the middle one. If there’s an even set, average the two middle numbers.
How do you find mode when numbers repeat?
Count how many times each number appears. The number that appears most is the mode.
Why do students use this calculator?
It saves time, reduces errors, and helps them understand averages clearly.
Can this calculator handle big numbers?
Yes! It works with both small and large sets of numbers.
What makes mean, median, and mode different?
Mean adds all numbers and divides. Median finds the middle. Mode finds the most frequent. Each gives a different view of your data.
When should I use median instead of mean?
Use median when your data has extreme values. For example, if one person has a huge income, median shows the typical income better than mean.
Why is mode important in daily life?
Mode helps identify the most common item, like the most sold product or the most popular shoe size.
Can I calculate averages for money?
Yes, mean, median, and mode work for dollars, rupees, euros, or any currency.
Is it okay to have more than one mode?
Yes! If two or more numbers appear equally often, your set is multimodal.
Can I use it for grades?
Absolutely! Track test scores, average homework marks, or overall performance easily.
What if I have an odd number of numbers?
Median will simply be the middle number. Easy!
Can I use it for sports scores?
Yes, calculate average points, most common scores, or the middle score.
How accurate is the calculator?
It’s 100% accurate, even for hundreds of numbers.
Do I need to be good at math to use it?
Not at all! Just type your numbers and click calculate.
Does it help in business?
Yes, it helps track sales, profits, and expenses without mistakes.
Final Thought
Numbers tell a story, and understanding them shouldn’t feel hard or confusing. A Mean / Median / Mode Calculator, combined with visual charts, turns raw data into clear, meaningful insights that anyone can understand. Whether you are a student checking your grades, a teacher analyzing class performance, a business owner tracking sales, or someone monitoring personal progress, these tools save time, prevent mistakes, and make learning or decision-making enjoyable.
Using these calculators helps you see patterns instantly. For example, if your weekly scores are up and down, the mean shows your overall performance, the median highlights the middle point, and the mode shows your most common result. By comparing these three, you get a full picture — something numbers alone might not show.
Beyond school, these tools are practical in daily life. You can track expenses, budget your money, or monitor health and fitness progress. In business, they help identify trends, spot outliers, and plan strategically. Even in surveys or polls, understanding averages visually gives you insights quickly.
The best part is that you don’t need to be a math expert to benefit. With a calculator, you enter your numbers, see the results instantly, and visualize them in a chart that makes sense at a glance. Start exploring your data today — clarity, confidence, and smarter decisions are just a calculation away. Numbers aren’t just numbers anymore; they become meaningful, actionable information that empowers you.
The Mean / Median / Mode Calculator is an invaluable tool that enhances your understanding of data by providing immediate insights into numerical distributions. By utilizing this calculator, users can easily interpret complex data sets and make informed decisions based on statistical averages. This facilitates a more comprehensive analysis, whether for personal finance, health monitoring, or business strategy. Embrace the power of data analysis and transform raw numbers into actionable insights that drive success.
Conclusion
A mean median mode calculator is more than just a tool — it’s a time-saver, a teacher, and a helper all in one. Whether you’re a student, teacher, business owner, or just curious about your personal data, this tool makes understanding numbers simple and fun.
Instead of stressing over calculations, let the calculator do the work. Track your progress, plan smartly, and make confident decisions. Start using a statistics calculator today, and turn numbers into clarity!
Thank you for reading this post, don't forget to subscribe!