Percentage Increase / Decrease Calculator
10 Simple Ways to Use a Percentage Increase / Decrease Calculator for Accurate Results
Understanding numbers and percentages is a part of everyday life. From shopping discounts to tracking your grades, salary raises, or even your business growth, percentages are everywhere. But calculating the percentage change between two numbers manually can be tricky and time-consuming. A Percentage Increase / Decrease Calculator is a perfect tool to simplify this process. It helps anyone, whether a student, professional, or everyday user, quickly calculate percentage changes without mistakes.
This guide will explore everything you need to know about a Percentage Increase / Decrease Calculator. We’ll explain how it works, show real-life examples, highlight common mistakes, share tips for accurate results, and answer all frequently asked questions. By the end of this guide, you will understand percentages better and be able to use an online calculator effectively.

Table of Contents
What is a Percentage Increase / Decrease Calculator?
A Percentage Increase / Decrease Calculator is a simple tool that calculates the percentage change between two numbers. Percentage increase shows how much a value has grown, while percentage decrease shows how much it has reduced.
For example, if you had $200 last month and now have $250, the calculator shows a 25% increase. If an item cost $150 and now costs $120, it shows a 20% decrease.
Mathematically, the formulas are:
- Percentage Increase = ((New Value – Old Value) ÷ Old Value) × 100
- Percentage Decrease = ((Old Value – New Value) ÷ Old Value) × 100
While these formulas are simple, calculating them every time manually can be tedious and prone to errors. That’s why an online calculator is very convenient. It gives accurate results in seconds.
Why Use a Percentage Increase / Decrease Calculator?
There are many reasons why this calculator is useful.
- Saves Time: No need to manually subtract, divide, or multiply. You just enter your numbers.
- Ensures Accuracy: Manual calculations can lead to errors. The calculator guarantees correct results every time.
- User-Friendly: Most calculators are simple, free, and easy to use.
- Versatile: Works for finances, education, business, or personal use.
- Accessible Anywhere: Online calculators work on desktops, laptops, tablets, or phones.
For students, it helps track grades or score improvements. For business professionals, it assists in analyzing profits, revenue growth, or price changes. For shoppers, it calculates discounts or price increases quickly. In every case, it makes working with numbers simple and understandable.
How to Use a Percentage Increase / Decrease Calculator Step by Step
Using a percentage calculator is simple, even for beginners. Follow these steps:
- Enter the original value – This is your starting number, like the old price, old score, or initial value.
- Enter the new value – This is the updated number, such as the new price, new score, or current value.
- Choose increase or decrease – Select the type of calculation you want. The calculator will adjust accordingly.
- Click calculate – The tool instantly shows the result.
- Review the result – You will see both the numeric change and the percentage change.
The calculator may also show a step-by-step explanation to help you understand how the result was derived. This makes it educational as well as practical.
Real-Life Examples of Using a Percentage Increase / Decrease Calculator
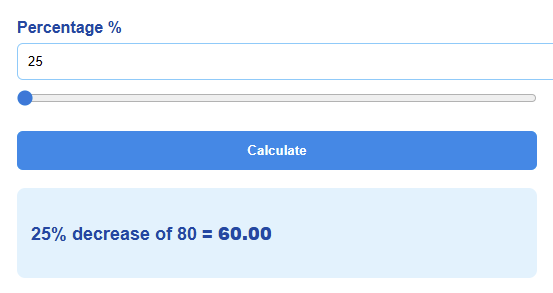
Example 1: Shopping Discounts
Imagine a jacket originally costs $80 and is on sale for $60. The calculator shows a 25% decrease, instantly telling you how much you save. Without a calculator, you would need to subtract $60 from $80 to find the difference ($20), divide $20 by $80, and then multiply by 100. This is correct, but time-consuming. The calculator simplifies it instantly.
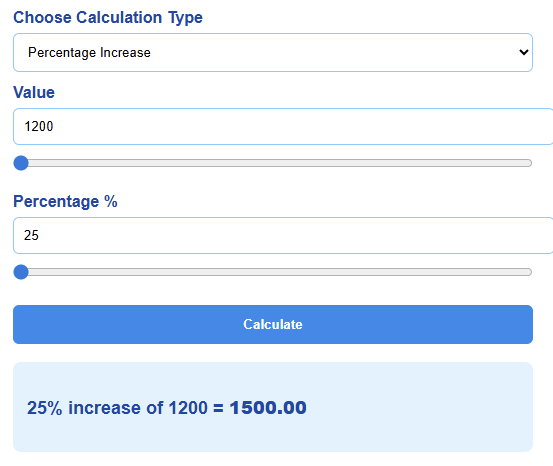
Example 2: Salary Increase
Your salary increases from $1,200 to $1,500. Using the calculator, you see a 25% increase. It helps you understand the exact growth in your income and compare it with previous raises. This is particularly useful if you want to track multiple salary changes over time.
Example 3: Business Growth
A company made $10,000 in sales last month and $12,500 this month. The calculator shows a 25% increase. This quick calculation helps business owners monitor growth and make informed decisions. Comparing multiple months becomes effortless with a calculator, saving time and avoiding errors.
Example 4: Exam Score Improvement
A student scored 70 marks on one test and 85 on another. The calculator shows a 21.4% increase. This allows students to quickly see their progress and motivates them to improve further. Understanding score improvements in percentage terms gives better perspective than simply seeing the numeric difference.

Example 5: Price Changes in Daily Life
If groceries cost $45 last month and $50 this month, the calculator shows an 11.1% increase. For regular shoppers, this is an easy way to track price fluctuations and manage budgets effectively.
Explanation of the Percentage Increase / Decrease Chart
This chart is designed to make the idea of percentage increase and percentage decrease easier to understand by turning numbers into a clear picture. Instead of trying to compare changes by looking at raw values, the chart gives you a simple visual comparison. It shows how four different items—Product A, Product B, Product C, and Product D—have either increased or decreased in percentage. The goal of this chart is to help readers quickly see which items grew, which ones dropped, and how big those changes were.
The chart uses two main colors to keep things simple. The blue bars show percentage increases, while the red bars show percentage decreases. This color separation makes it easy to know what is growing and what is falling. You don’t have to think too much because the graph gives you the answer immediately. Blue means growth or improvement. Red means a drop or decline. Even a person without any math background can understand the difference at a glance.
For Product A, you can see a blue bar reaching up to 15%. This means Product A has increased by 15%. In simple words, whatever its original value was, it went up by 15%. This kind of increase could represent many things, such as a rise in price, a growth in sales, an improvement in marks, or an increase in quantity. The important part is that the blue bar clearly shows the direction— upward.
Then you have the red bar for Product A, which sits at -10%. That negative sign is what makes it a decrease. A negative value always shows a drop. So, Product A also has a 10% decrease shown, which might represent something else in a real-life case. For example, maybe its sales increased by 15%, but its profit margin decreased by 10%. The chart is flexible enough to be used for almost any type of data.
Product B shows an even sharper example of change. Its increase bar rises up to 25%, showing a stronger positive jump than Product A. That means Product B has grown more. The red bar for Product B goes down to -20%, meaning it also has a decrease somewhere else. This makes Product B an item with high movements in both directions. In real life, something like this could happen if a product gets more popular but also gets more expensive, or if scores improve in one area but drop in another.
What makes this chart helpful is the clear contrast. When you compare the blue bars of Product A and Product B, you immediately see that Product B has a larger increase. When you compare their red bars, you can tell that Product B also has a larger decrease. You do not need to calculate anything. You do not even need to read the values if you don’t want to. The height of the bars tells you the story.
Product C shows a smaller increase of 10% compared to Products A and B. This helps the viewer notice that not all items grow at the same rate. The red bar for Product C shows a -15% drop, which is bigger than its increase. When the decrease bar is longer than the increase bar, it means the value went back down more than it went up. This kind of comparison is very important when you want to judge performance or changes over time.
Product D has the biggest increase out of all items on this chart, with a blue bar reaching 30%. That means it has the strongest improvement or growth. A 30% rise is considered very high in many situations. It can mean higher income, more customers, more marks, higher production, or anything else that grows in percentage form. The red bar for Product D shows only -5%, which is a very small decrease. This tells the viewer that Product D is overall performing very well. Even with a small drop, its overall movement is upward and strong.
The point of this entire chart is to help the user understand how increases and decreases compare across multiple items. Without the chart, you would have to imagine each percentage or compare them manually. With the chart, your eyes do the work automatically. This is one of the biggest strengths of visual data. People process images much faster than text or numbers, so a chart like this is ideal for helping readers learn and understand percentage changes.
Another important part of this chart is that it uses both positive and negative values. Positive percentages point up, and negative percentages point down. This dual-direction structure makes it feel very natural. When you see something going upward, you think of growth, profit, success, and improvement. When you see something going downward, you think of loss, drop, slowdown, or decline. The chart works with that natural understanding so the user does not have to think hard.
The y-axis of the chart is simple and clean. It begins at zero and goes upward for the increases and downward for the decreases. The layout is designed so even a beginner can understand it without feeling overwhelmed. Nothing is complicated or cluttered. There are no unnecessary lines or confusing shapes. It is clean, minimalistic, and focused only on what matters—the percentage changes.
Charts like this are especially helpful for blog readers because percentage increase and decrease are topics that many people struggle with. When numbers move up or down, the direction and amount can confuse people. But when you show those changes visually, everything becomes much clearer. Readers can relate to the chart even if they did not follow the formulas or math behind the scenes.
This chart also teaches a very important lesson: not all increases and decreases are equal. A 10% drop does not have the same impact as a 30% rise. A 25% increase does not feel the same as a 5% decrease. By showing different values together, the chart helps people understand real differences in scale and impact.
Overall, this chart is not just a decoration. It is a learning tool. It takes the core idea of percentage change and turns it into a simple visual form. Anyone can understand it, whether they are a student, a business owner, a casual reader, or someone just curious about percentage math. It supports the main topic of the blog by showing exactly how percentage increase and decrease look when placed side by side. It makes learning easier, faster, and more enjoyable.
Tips, Mistakes, and Best Practices
Common Mistakes People Make
- Using the wrong original value: Always ensure the original value is the baseline for the calculation. Mixing up new and old values can give incorrect results.
- Ignoring whether it’s an increase or decrease: Forgetting this can lead to confusion.
- Manual errors: Mistakes happen when doing math by hand, especially with decimals.
- Rounding too early: Rounding numbers before calculating can distort the final percentage.
Helpful Tips for Better Results
- Always double-check which number is the original value.
- Use an online calculator for accurate and instant results.
- Review any step-by-step explanations to understand the calculation.
- Keep units consistent – for example, don’t mix dollars with percentages.
- Use the calculator regularly to compare multiple values or track trends over time.
How a Percentage Increase / Decrease Calculator Helps Different Users
Students
- Track exam scores and improvements.
- Compare assignments over time.
- Understand grade changes in percentage form.
Business Professionals
- Calculate profit margins.
- Track revenue growth or decline.
- Analyze product price changes.
Shoppers
- Quickly calculate discounts or sale prices.
- Compare old and new prices to find the best deals.
- Track household expenses.
Everyday Users
- Monitor monthly bills or expenses.
- Track savings or investments.
- Compare performance metrics, like fitness progress or personal goals.
Understanding Percentage Increase vs. Percentage Decrease
A percentage increase is when a value grows compared to its original number. For example, a raise from $1,000 to $1,200 is a 20% increase.
A percentage decrease is when a value reduces compared to its original number. For instance, a price drop from $150 to $120 is a 20% decrease.
The calculator helps clearly identify which type of change occurs, and it shows the exact percentage so users can understand the scale of the change.
Frequently Asked Questions (FAQs)
How do I use a Percentage Increase / Decrease Calculator?
Enter the original value, the new value, select increase or decrease, and click calculate. The tool shows the percentage change instantly.
Is the calculator accurate?
Yes, it uses standard formulas to ensure precise results every time.
Can I use this calculator for business purposes?
Absolutely. It works for sales, revenue, price changes, and more.
Can students use this tool?
Yes, it’s perfect for tracking grades or progress.
Is it free to use?
All online calculators of Calculatorsera.com are completely free.
Do I need to install anything?
No, it works directly in any browser.
Can I use decimals?
Yes, the calculator handles decimals as well as whole numbers.
Does it show step-by-step calculations?
Many calculators provide step-by-step explanations to help users understand the process.
What if the new value is smaller than the original value?
The calculator automatically calculates it as a percentage decrease.
Can I use it for multiple comparisons?
Yes, you can calculate individual items sequentially or track changes over time.
How do I manually calculate a percentage increase?
Subtract the original value from the new value, divide by the original value, and multiply by 100.
How do I manually calculate a percentage decrease?
Subtract the new value from the original value, divide by the original value, and multiply by 100.
Practical Examples of Applying This Calculator in Daily Life
- Salary Raises: Track your raises over several years to understand total growth.
- Price Discounts: Calculate exact savings during sales or promotions.
- Business Metrics: Monitor revenue or product price changes month by month.
- Student Scores: Evaluate performance improvements in exams, tests, and assignments.
- Personal Expenses: Track increases in bills, rent, or groceries over time.
Using a calculator makes these comparisons easy, fast, and accurate. It removes the guesswork and provides clarity.
Final Thoughts on Percentage Increase / Decrease Calculator
A Percentage Increase / Decrease Calculator is an essential tool for anyone dealing with numbers. It saves time, prevents mistakes, and provides instant results. Whether you are a student, a business professional, a shopper, or just managing personal finances, it makes understanding percentage changes simple and accurate.
By using an online calculator, you also gain confidence in interpreting results. You don’t just see numbers; you understand what those numbers mean in context. Step-by-step explanations, accuracy, and instant results make it an indispensable tool for daily life.
Try it today to simplify your calculations and take control of your numbers. Whether comparing prices, tracking growth, or analyzing changes, this calculator ensures clarity, accuracy, and understanding every time.
Thank you for reading this post, don't forget to subscribe!