Mortgage Calculator
Calculatorsera.com
10 Smart Tips to Master Your Home Loan with a Mortgage Calculator
📝 Introduction
Buying a home is exciting—but it can also feel a little scary. A mortgage is simply a loan you take from a bank to buy a house. You promise to pay it back slowly, usually month by month. But figuring out how much you’ll pay each month can be confusing. Interest rates, taxes, insurance, loan terms, and down payments all affect your payment.
This is where a Mortgage Calculator becomes your best friend. Think of it as a helpful tool that shows exactly how much you’ll pay and how fast you can pay off your home. It removes guesswork, reduces stress, and makes the entire process easier. Understanding mortgages is not scary—it’s empowering.

Table of Contents
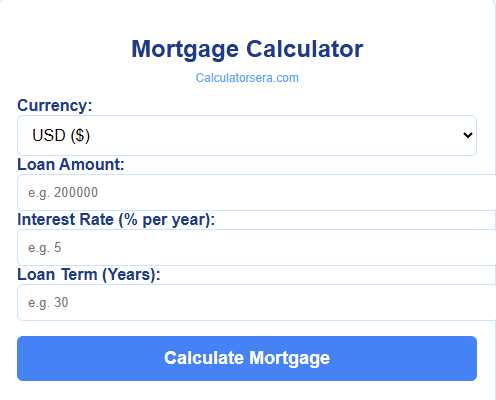
What Is a Mortgage Calculator?
A Mortgage Calculator is a tool that helps you estimate your monthly mortgage payment. It splits your payment into two main parts:
- Principal – the actual amount of money you borrowed.
- Interest – what the bank charges for lending you money.
Other costs can include:
- Property taxes – money you pay the government yearly for your house.
- Homeowners insurance – protects your home from damages.
- HOA fees – for community or apartment living.
Example:
If your house costs $200,000 and your monthly payment is $1,200:
- $800 might go to the bank (interest)
- $400 reduces your loan (principal)
The calculator also shows an amortization chart, which is a fancy way of saying it shows how your payments reduce your loan over time.
Why People Need a Mortgage Calculator
A mortgage calculator is useful for anyone buying a home, especially first-timers.
- Plan monthly budgets: If you earn $3,000 per month, you can see how much is safe to spend on your mortgage.
- Compare loans: Different banks offer different interest rates. The calculator shows which one costs less.
- Check affordability: Before signing papers, you’ll know if you can really handle the monthly payment.
Using a calculator reduces stress, removes guesswork, and gives you confidence in your decisions.
How a Mortgage Calculator Works (Step-By-Step)
Here’s what you enter and what it tells you:
- Home Price – Total cost of your home.
- Down Payment – Money you pay upfront. Bigger down payments lower monthly payments.
- Interest Rate – Bank’s charge for lending money. Lower rates = lower payments.
- Loan Term – Usually 15 or 30 years. Shorter terms = higher monthly payment, less total interest.
- Taxes & Insurance – Optional, but gives a full picture of your monthly cost.
- HOA Fees – Optional, for condos or community living.
- Amortization Chart – Shows how each payment reduces the principal and interest.
- Payment Breakdown – How much goes to principal vs. interest each month.
PAA Questions
- How do you calculate monthly mortgage payments?
The calculator uses your loan amount, interest rate, and loan term to show your monthly cost instantly. - How does down payment affect monthly payments?
A larger down payment reduces your loan, which lowers your monthly payment. - Is it better to get a 15-year or 30-year mortgage?
A 15-year mortgage has higher payments but costs less overall. A 30-year mortgage has smaller payments but more interest over time. - Can a mortgage calculator include taxes and insurance?
Yes! You can add them to see the full monthly cost. - How do extra payments affect mortgage payoff?
Extra payments reduce principal faster, which saves interest and shortens the loan term.
Manual Method
If you want to see how the calculator works behind the scenes, here’s the formula: M=Pr(1+r)n(1+r)n−1M = P \frac{r(1+r)^n}{(1+r)^n – 1}M=P(1+r)n−1r(1+r)n
Where:
- M = monthly payment
- P = loan amount (principal)
- r = monthly interest rate (annual ÷ 12)
- n = total number of payments (years × 12)
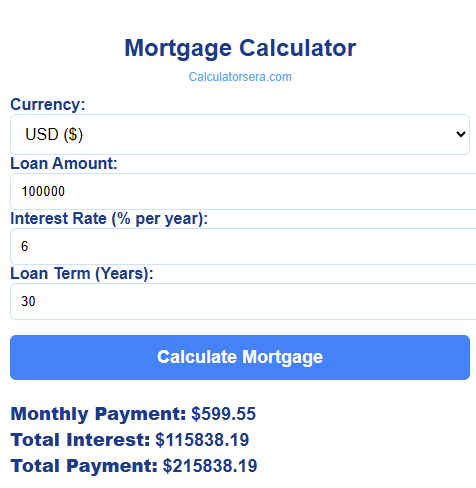
Example 1:
Loan = $100,000
Interest = 6% annually → 0.5% monthly
Term = 30 years → 360 months M=100,000×0.005(1+0.005)360(1+0.005)360−1≈$599M = 100,000 \times \frac{0.005(1+0.005)^{360}}{(1+0.005)^{360}-1} \approx \$599M=100,000×(1+0.005)360−10.005(1+0.005)360≈$599
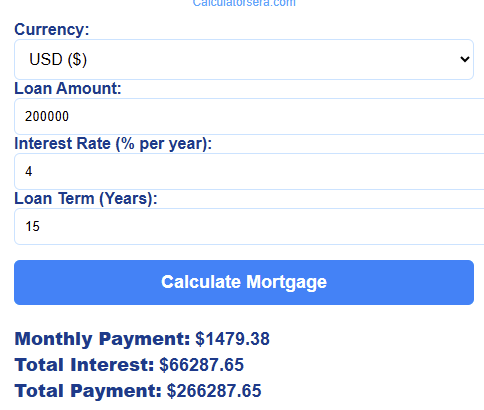
Example 2:
Loan = $200,000
Interest = 4% annually → 0.33% monthly
Term = 15 years → 180 months M≈$1,479M \approx \$1,479M≈$1,479
This shows the principal and interest part of your monthly payment. Taxes and insurance are extra.
Benefits of Using a Mortgage Calculator
Using a mortgage calculator is not just about numbers. It gives peace of mind:
- Removes confusion: No more guessing your payment.
- Saves time: Calculates instantly instead of doing manual math.
- Helps make better financial decisions: Compare loans and see what you can afford.
- Reduces stress: Home buying feels manageable.
- Shows real cost over time: See total interest and principal breakdown.
- Helps compare loans instantly: Pick the best deal in minutes.
Advanced Features
Modern mortgage calculators offer more than basic estimates:
- Extra monthly payments – see how paying more shortens your loan.
- One-time lump-sum payments – plan for big payments and save interest.
- Loan payoff acceleration – track how soon you’ll finish paying.
- Interest savings chart – visualize how extra payments reduce interest.
- Amortization table – detailed month-by-month payment breakdown.
- PMI calculations – private mortgage insurance for smaller down payments.
- Refinance comparison – see if switching loans saves money.
Comparison Table
| Feature | Manual Calculation | Mortgage Calculator |
|---|---|---|
| Accuracy | Moderate, prone to errors | High, automated |
| Speed | Slow, multiple steps | Instant results |
| Ease | Requires formulas & math | Simple, user-friendly |
| Best Use | Learning concepts | Practical home buying decisions |
Mortgage Payment Breakdown Chart
This chart shows how your monthly mortgage payment is split between principal, interest, taxes, and insurance over time. It helps homeowners understand where their money is going each month and visualize how their loan balance decreases.
Explanation of the Mortgage Payment Breakdown Chart
Understanding a mortgage can be confusing, but visualizing your payments makes it easier. This Mortgage Payment Breakdown Chart shows exactly how each portion of your monthly payment changes over time. Let’s break it down in detail.
1. Principal
The principal is the actual money you borrowed from the bank to buy your home. Each month, part of your payment goes toward reducing this amount.
- In the early years of a mortgage, a smaller portion of your payment goes to the principal, while more goes to interest.
- Over time, the principal portion increases as the interest portion decreases.
Example:
- Year 1: $4,000 of your payments go toward principal
- Year 10: $6,000
- Year 30: $10,500
This shift happens because mortgage interest is calculated on the remaining loan balance. As the balance drops, interest decreases, and more of your payment reduces the principal.
Tip: Using a mortgage calculator helps you see how extra payments accelerate principal reduction, saving interest and shortening the loan term.
2. Interest
Interest is the cost of borrowing money from the bank. At the beginning of a mortgage, your interest is high because the loan balance is high.
- Year 1: $8,000 goes to interest
- Year 10: $6,000
- Year 30: $2,000
Notice the downward trend. The longer you pay, the less interest you pay each month because the loan balance decreases.
Why this matters:
- Understanding interest helps you plan whether a 15-year or 30-year mortgage is better.
- Extra payments toward principal significantly reduce total interest paid.
3. Taxes
Property taxes are collected by the local government to fund schools, roads, and other services.
- They are usually calculated as a percentage of your home value.
- Taxes can slightly increase each year if your home value rises or local tax rates change.
Example from chart:
- Year 1: $1,200
- Year 5: $1,320
- Year 30: $2,400
Including taxes in a mortgage calculator ensures you know your true monthly payment, not just the principal and interest.
4. Insurance
Homeowners insurance protects your property against damages like fire, theft, or natural disasters.
- Insurance usually stays consistent unless your coverage changes or your property value increases.
- In our chart, it remains at $500 per year for simplicity.
Including insurance in your mortgage calculation prevents surprises in your monthly budget.
5. How the Chart Helps Home Buyers
This chart is more than just numbers; it’s a powerful planning tool.
- Visual clarity: You instantly see how your money is allocated each year.
- Motivation for extra payments: Seeing how interest decreases over time encourages paying a little extra toward principal.
- Budget planning: Knowing taxes and insurance ensures you don’t underestimate your monthly cost.
- Loan comparison: Compare 15-year vs. 30-year mortgages visually to pick the best plan.
Practical insight:
- Early in the mortgage, most of your money goes to interest. That’s normal and expected.
- Over time, you build equity—ownership in your home—which grows as the principal portion increases.
6. Connecting the Chart to a Mortgage Calculator
A mortgage calculator automatically generates this chart for any home price, down payment, interest rate, and loan term you enter.
- Enter your home price, down payment, and loan term.
- Add taxes and insurance to see the complete payment.
- Adjust the interest rate to simulate different bank offers.
The chart instantly shows:
- How payments split between principal, interest, taxes, and insurance.
- How extra payments reduce the total interest over the loan’s life.
- When you’ll fully pay off your mortgage.
Pro Tip: You can also simulate refinancing scenarios using the chart to see how a lower interest rate affects payments.
7. Why Every Home Buyer Should Use This Chart
- Transparency: Understand where every dollar of your payment goes.
- Confidence: Visual proof of how the mortgage works reduces anxiety.
- Savings Opportunities: Spot areas to reduce costs, like paying extra principal or refinancing.
- Planning Ahead: Predict future cash flow needs for taxes, insurance, and loan payments.
8. Real-World Example
Let’s say you buy a $250,000 home with a 4% interest rate and a 30-year mortgage:
- Monthly principal & interest: ~$1,193
- Taxes: $300/month
- Insurance: $100/month
Total monthly payment: $1,593
The chart will show:
- Principal gradually rising from $400 to $1,050 per month
- Interest decreasing from $800 to $200 per month
- Taxes and insurance steady or slightly increasing
You can instantly see how paying $50 extra per month toward principal reduces total interest and shortens your loan by several years.
A Mortgage Payment Breakdown Chart is an essential visual tool that complements your mortgage calculator.
- It explains in a simple, visual way how your money is used.
- It empowers you to make smarter financial decisions.
- It helps plan your budget, savings, and future home improvements.
When combined with a mortgage calculator, this chart gives you full control and confidence over your home loan.
Knowing exactly where your payments go is empowering. Use the chart to visualize, plan, and step into homeownership with confidence and clarity.
Mortgage Amortization Line Chart
This chart illustrates how the loan balance decreases over time. It helps homeowners understand the pace of equity building and how payments affect the remaining mortgage.
Explanation of the Mortgage Amortization Line Chart
Understanding your mortgage isn’t just about monthly payments—it’s also about seeing how your loan balance decreases over time. This line chart makes it easy to visualize the journey from your first payment to being fully mortgage-free.
1. What Is Mortgage Amortization?
Amortization is the process of paying off your loan gradually. Each monthly payment reduces the principal slightly, while the rest goes to interest.
- Early in the loan, most of your payment goes toward interest.
- Later, the principal portion grows, accelerating equity in your home.
The line chart clearly shows this shift: the slope starts slowly (high interest, low principal) and steepens as your balance drops faster in later years.
2. Reading the Chart
- X-axis (Years): Each year of your mortgage, from 1 to 30.
- Y-axis (Remaining Loan Balance): How much money you still owe the bank.
- Line Trend: Downward curve representing the loan balance decreasing over time.
Example Data:
- Year 1: $245,000 remaining (loan $250,000, $5,000 principal paid)
- Year 10: $200,000 remaining
- Year 20: $120,000 remaining
- Year 30: $0 remaining (fully paid off)
The line’s slope is gradually steeper after the first 10–15 years, showing how more of your payment goes to principal as interest decreases.
3. Why This Chart Is Powerful for Home Buyers
- Visualizes Progress: Instead of looking at numbers on paper, you see your loan shrink visually.
- Motivates Extra Payments: Even a small extra monthly payment significantly accelerates payoff, which would steepen the line further.
- Predicts Equity Growth: You can estimate how much of your home you “own” each year.
- Planning Tool: Helps plan for refinancing, selling, or making lump-sum payments.
4. Amortization vs. Mortgage Payment Breakdown
While the previous bar chart focused on monthly payment distribution (principal, interest, taxes, insurance), this line chart emphasizes long-term loan reduction. Both are crucial:
- Bar chart: Helps budget monthly expenses.
- Line chart: Helps plan long-term financial strategy and equity building.
Together, they give a complete view of your mortgage.
5. Practical Example
Suppose you buy a $250,000 home with a 4% interest rate, 30-year mortgage, and $10,000 down payment.
- First month: $1,200 payment → $200 principal, $1,000 interest
- After 5 years: $12,000 principal paid → loan balance $238,000
- After 15 years: $80,000 principal paid → loan balance $160,000
- After 30 years: $240,000 principal paid → loan balance $0
The chart reflects this visually, showing the initial slow decline, then faster reduction later.
6. Extra Payments and Chart Impact
If you make extra monthly payments, the chart changes dramatically:
- Remaining balance drops faster.
- You pay less total interest.
- You may finish the mortgage in 25 years instead of 30.
Example: Adding $100 extra per month toward principal:
- Year 10 balance: $180,000 instead of $200,000
- Year 20 balance: $80,000 instead of $120,000
Visualizing this makes the impact of extra payments obvious and motivating.
7. Why Home Buyers Need This Chart
- Clear Loan Insight: Know exactly how much you owe at any point.
- Confidence: Reduces mortgage anxiety.
- Decision-Making: Helps determine whether refinancing or additional payments make sense.
- Goal Tracking: See progress toward financial freedom visually.
Using this with a mortgage calculator is a complete strategy for smart home buying.
8. Combining Both Charts for Maximum Effect
- Bar chart (Payment Breakdown): Monthly clarity
- Line chart (Amortization): Long-term clarity
Together, they allow you to:
- Plan monthly budget
- Track equity growth
- Minimize interest with extra payments
- Make informed refinancing or loan decisions
This dual-chart approach empowers homeowners with knowledge, reduces confusion, and makes mortgage planning actionable.
The Mortgage Amortization Line Chart shows the long-term effect of your monthly mortgage payments. It’s a visual roadmap from your first payment to full home ownership. Combined with a mortgage calculator, it helps you:
- Understand loan reduction over time
- Plan extra payments strategically
- Build equity faster
- Gain confidence in financial decisions
Using both charts together makes your mortgage journey transparent, empowering, and stress-free. Knowing how your payments affect your loan balance lets you take control, save money, and confidently step into your dream home.
FAQs
Which mortgage type is best for beginners?
Fixed-rate mortgages are simple and predictable, making them ideal for first-time buyers.
How much down payment should I save?
Typically 20% of the home price. Smaller down payments are possible but may require PMI.
What happens if I miss payments?
Missing payments can result in late fees, higher interest, and even foreclosure.
Can mortgage payments change over time?
Yes, adjustable-rate mortgages may change, but fixed-rate payments stay the same.
How do interest rates affect monthly payments?
Higher interest rates increase monthly payments; lower rates reduce them.
What factors affect mortgage approval?
Income, credit score, debt-to-income ratio, and down payment size.
How does credit score influence mortgage rates?
Higher credit scores usually get lower interest rates, saving money.
Can I use a mortgage calculator for refinancing?
Yes, enter new loan terms to see potential savings.
How much income do I need for a mortgage?
Banks often recommend your monthly mortgage be less than 28% of your gross monthly income.
Does paying extra monthly help?
Yes! Extra payments reduce interest and shorten your loan term.
Can I include taxes and insurance in the calculator?
Absolutely, for a complete picture of your monthly cost.
Is it better to buy a smaller home first?
It depends on your budget. A smaller home may be easier to afford and pay off faster.
How does loan term affect total interest?
Shorter loans save interest, but monthly payments are higher. Longer loans cost more in interest but are easier monthly.
Can I calculate mortgage affordability online?
Yes, mortgage calculators help you see what fits your budget.
Are calculators 100% accurate?
They are very accurate for estimates but may not include all fees, so check with your lender.
Conclusion
The Mortgage Calculator serves as an essential tool for potential home buyers, enabling them to better understand their financial commitments. The chart reflects this visually, showing the initial slow decline, then faster reduction later. By integrating the insights from this chart with the Mortgage Calculator, buyers can devise a comprehensive strategy that maximizes their investment. This dual approach enhances decision-making and fosters a clearer understanding of the overall mortgage landscape.
Understanding your mortgage is empowering. A mortgage calculator gives clarity, control, and confidence. It helps you see the real cost, compare loans, and plan for the future.
Knowing your mortgage numbers gives you confidence and control. Use a mortgage calculator today and step into your dream home with ease!
Thank you for reading this post, don't forget to subscribe!