Percentage Calculator
7 Smart Ways a Percentage Calculator Makes Math Easy for Everyone (2025 Guide)
A Percentage Calculator is one of the simplest but most useful tools you can use in daily life. Whether you are a student, a shopkeeper, a business owner, or someone who just wants to understand numbers better, a percentage tool can save you time and stress. Many people struggle with percentages like increase, decrease, discounts, or comparing two numbers—but with an Online Percentage Calculator, everything becomes much easier.

This page is made for anyone who wants fast, clear, and accurate percentage answers. You don’t need to memorize formulas or do long calculations. Just enter your numbers and let our calculator do the work for you.
In this full guide, you will learn:
Table of Contents
Let’s begin.
What Is a Percentage Calculator?
A Percentage Calculator is a simple online tool that helps you find percentages quickly without doing math by hand. You only need to enter the numbers, and the tool shows you the correct answer within a second.
A percentage is a way to compare numbers using “out of 100.”
For example:
- 20% means 20 out of 100
- 50% means 50 out of 100
- 75% means 75 out of 100
In real life, percentages are everywhere:
- Discounts on shopping
- School exam marks
- Interest rates
- Tax
- Growth or decrease
- Comparing two values
A Free Percentage Calculator makes all these tasks simple. You don’t need formulas or a calculator device—just type numbers into the tool online.
Simple Example
If you want to find 20% of 150, you just write:
150 × 20% = 30
But instead of doing this manually, you put the numbers in the calculator, hit calculate, and instantly get 30.
This is why millions of people use percentage tools every day.
Why Use a Percentage Calculator?
Using a Percentage Calculator gives many benefits, especially when you want quick and correct results. Here are the main reasons people prefer using it:
1. Fast Results
You get answers in less than a second. No formulas, no thinking, no mistakes.
2. Easy to Use
Even a 5th-grade student can use it. Just enter your numbers and click calculate.
3. Saves Time
Perfect for busy workers, students, and shoppers.
4. Accurate
Humans make mistakes, but tools don’t. The calculator gives you the most accurate percentage every time.
5. Free and Online
You can use our Online Percentage Calculator anytime, anywhere—on mobile, tablet, or computer.
6. Handles Different Types of Percentage Problems
Such as:
- Percentage increase
- Percentage decrease
- Percentage difference
- What percent of a number
- Number to percentage
- Percentage of a total
This makes it useful for people in school, business, shopping, finance, and more.
How to Use Our Percentage Calculator (Step by Step)
Using our Percentage Calculator is simple and takes only a few seconds. Here’s how to do it:
Step 1 — Enter the First Number
This may be the total, the old value, or the first value you want to compare.
Step 2 — Enter the Second Number
This may be the part, the new value, or the number you want to compare.
Step 3 — Choose the Type of Percentage You Want
Examples include:
- Percentage of a number
- Percentage increase
- Percentage decrease
- Percentage difference
Step 4 — Click “Calculate”
The result appears instantly.
Step 5 — View Your Answer
You will see:
- The percentage
- The explanation
- The steps if needed
This makes the tool helpful for learning as well as calculating.
visualization
Simple Chart explanation
This chart is a simple, visual representation of two numerical values and the percentage difference between them. It uses a combination of bars and a line to show both the raw numbers and the calculated percentage change. The bars represent the actual values, while the line represents the percentage difference between the first and second value. This combination allows a clear understanding of both the scale of the values and how much they differ in relative terms.
The chart has two bars. The first bar represents Value A, which can be considered the base or starting point. The second bar represents Value B, which can be considered the new or compared value. By looking at the height of the bars, a viewer can immediately understand which value is larger or smaller. The height difference between the two bars visually communicates the change in magnitude between these numbers, providing an intuitive grasp of the relationship without needing to perform any calculations mentally.
Alongside the bars, there is a line plotted on a separate axis to show the percentage difference. The line originates at zero and rises or falls depending on whether the second value is higher or lower than the first. This line is mapped to the right-hand axis, labeled in percentage terms, while the bar values are mapped to the left-hand axis. This dual-axis approach ensures that the raw numbers and the percentage change are displayed proportionally, making the chart easy to read and interpret.
The line provides a direct visual representation of how significant the change is between Value A and Value B. For example, if the line rises sharply, it indicates a large percentage increase from the first value to the second. If the line is close to zero or flat, it indicates a minor change. In the case where Value B is smaller than Value A, the line may point downward, indicating a decrease. This visual cue allows viewers to quickly understand the nature of the difference without performing any mathematical steps.
The chart is designed to be responsive, meaning it adjusts smoothly to different screen sizes. The bars and line scale proportionally, preserving clarity whether viewed on a large monitor or a smaller device. This responsiveness ensures that the visual relationships between the numbers and percentages remain consistent, helping the viewer interpret the data accurately regardless of the viewing environment.
The bar colors and line styling are intentionally simple to focus attention on the values themselves rather than decorative elements. The bars are uniform in color, giving a clean appearance that emphasizes the height differences rather than distracts with patterns or gradients. The line uses a contrasting color to differentiate the percentage change clearly from the bars. Its slightly curved tension makes it visually smooth, guiding the eye naturally from the first value to the second.
The chart also includes labels for both axes. The left axis shows the raw values corresponding to the bars, providing context for their height. The right axis shows percentages corresponding to the line, allowing the viewer to see precisely how much one value differs from the other in relative terms. These labels make the chart self-explanatory, so the viewer can understand the data without needing any accompanying text or explanation.
The chart allows for immediate comparison. By looking at the bars side by side, the viewer can see the difference in magnitude. The line provides a visual guide to the relative size of that difference. This combination of absolute and relative information makes the chart a powerful tool for understanding numeric changes at a glance. It communicates not just which value is larger, but by how much in both absolute and percentage terms.
In this chart, the percentage line is dynamically linked to the values of the bars. Any change in the bar heights automatically updates the line to reflect the new percentage difference. This ensures that the chart always represents the accurate relationship between the two values. The line acts as a bridge connecting the raw numbers to their proportional difference, making the chart informative in a single glance.
The use of only two bars keeps the chart uncluttered. By focusing on just two data points, the viewer can easily process the information without being overwhelmed by multiple values or comparisons. This simplicity emphasizes clarity and ensures that the relationship between the two values remains the focus. The viewer’s attention is drawn directly to the difference and its representation in percentage form.
The line’s placement on a separate axis enhances understanding by distinguishing between raw values and percentage changes. While the bars provide the concrete numbers, the line translates that information into a relative perspective. This dual perspective allows viewers to understand not just the numeric difference, but also how significant that difference is relative to the first value. This layered information provides deeper insight than either bars or line alone could achieve.
The visual combination of bars and line allows quick mental calculations. Even without reading the exact numbers, the viewer can approximate the percentage change based on the line’s slope and the difference in bar heights. The chart leverages visual intuition to communicate quantitative information efficiently, enabling fast comprehension without relying on formulas or textual explanation.
The chart’s clean design avoids distractions. There are no extra grid lines, colors, or decorative elements that might confuse the viewer. Every component serves a purpose: the bars show values, the line shows percentage, and the axes provide scale. This minimalistic design makes the chart easy to interpret and focuses the viewer’s attention on the relationship between Value A and Value B.
Overall, the chart is an effective way to communicate the magnitude and percentage change between two values visually. It allows viewers to understand both the absolute difference and the proportional difference in one glance. By using bars for absolute values and a line for percentage, it conveys a complete picture of the data. This combination makes interpreting numeric relationships faster, clearer, and more intuitive.
The simplicity of the chart also makes it versatile. It can represent a wide range of data types where two values need to be compared, and the percentage change is meaningful. The structure of two bars plus a percentage line makes it universally understandable, regardless of the specific numbers being displayed. Its design emphasizes clarity, accuracy, and immediate comprehension.
Finally, the chart shows how visual tools can enhance understanding. While numbers alone provide information, this visual representation communicates the same information more effectively and memorably. The chart turns abstract percentages into a tangible visual pattern, helping viewers see the relationship between two values at a glance and understand the magnitude and significance of their difference.
Real-Life Examples of Using a Percentage Calculator
Percentages are everywhere in your daily life. Here are simple and clear examples to help you understand how our calculator helps.
Example 1: Shopping Discount
A shirt costs $80, and there is a 25% discount.
Use the calculator:
- Old price: 80
- Percentage: 25%
Result: $20 discount
New price = $80 − $20 = $60
Easy and fast.
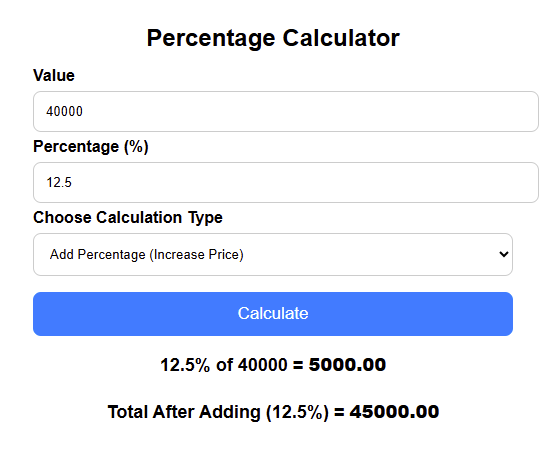
Example 2: Percentage Increase (Salary Raise)
Your salary increased from $40,000 to $45,000.
Use the Percentage Difference Calculator:
Percentage increase = ((45,000 − 40,000) ÷ 40,000) × 100
= 12.5%
So your salary increased by 12.5%.
Example 3: School Marks
You got 72 marks out of 100.
Percentage = (72 ÷ 100) × 100 = 72%
If it was out of 200 marks:
Percentage = (150 ÷ 200) × 100 = 75%
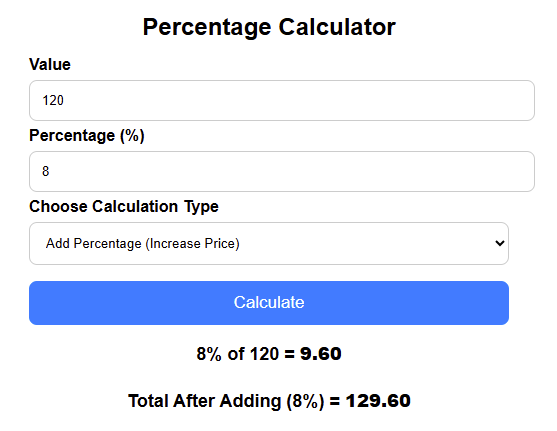
Example 4: Tax Calculation
If sales tax is 8% and your bill is $120:
8% of 120 = $9.60
Total bill = $120 + $9.60 = $129.60
Example 5: Business Profit Percentage
You bought something for $200 and sold it for $260.
Profit = 260 − 200 = 60
Profit percentage = (60 ÷ 200) × 100 = 30%
Our calculator solves this instantly.
These are just a few examples. You can calculate hundreds of different things using percentages each day.
Tips, Mistakes, and Best Practices
Using a Percentage Calculator is simple, but there are some things to keep in mind to get perfect results every time.
Common Mistakes People Make With Percentages
1. Confusing Percentage Increase and Decrease
People sometimes mix them up.
Example:
Going from 100 → 80 is a 20% decrease, not increase.
A calculator fixes this.
2. Using the Wrong Formula
Percentage problems have different formulas, so it’s easy to get confused.
Our tool uses the correct formula every time.
3. Entering Values in the Wrong Order
Old value should be entered first when calculating percentage increase or decrease.
4. Forgetting That Percent Means “Out of 100”
Many students forget this simple idea. That’s why online tools help them learn better.
5. Making Manual Calculation Mistakes
Even small mistakes like dividing wrong can change the whole answer.
Helpful Tips to Get Better Results
✓ Double-check the numbers
Make sure the values you enter match what you want to calculate.
✓ Use the right mode
If you want a decrease, choose decrease.
If you want a percentage of a number, choose that mode.
✓ Learn from the results
Our calculator shows steps, which helps students understand how percentages work.
✓ Use it for comparison
Percentage difference helps you compare prices, marks, growth, and trends.
✓ Use it for budgeting
Percentages help you manage money, savings, expenses, and plans.
Percentage Calculator for Different Users
Different people use percentage tools for different reasons. Here are some examples.
For Students
Students use percentages for:
- Exam marks
- Assignments
- Comparing results
- Learning math
- Understanding fractions
It helps them learn faster and avoid mistakes.
For Teachers
Teachers use it to:
- Check tests
- Make reports
- Compare performance
- Teach students better
For Shoppers
People use percentages for:
- Discounts
- Sales
- Special offers
- Comparing prices
For Business Owners
Businesses use percentages for:
- Profit and loss
- Tax
- Sales growth
- Price changes
- Staff performance
A Free Percentage Calculator save time and gives accurate numbers.
For Workers and Employees
Workers use percentages to calculate:
- Salary raise
- Bonus
- Commission
- Performance rating
For Finance Users
People in finance use this tool to calculate:
- Interest
- Tax
- Annual growth
- Market changes
- Investments
Frequently Asked Questions (FAQs)
How do I use a Percentage Calculator?
Just enter the numbers, choose the type of calculation, and click calculate. The tool shows instant results.
What is the easiest way to calculate a percentage?
The easiest way is to use an Online Percentage Calculator. It gives fast results without formulas.
Can I calculate percentage increase online?
Yes, you can calculate percentage increase by entering the old and new value in the tool and selecting “Percentage Increase.”
How do I calculate percentage decrease?
Enter the old value and new value and choose “Percentage Decrease.” The tool will show how much the value dropped.
What is percentage difference?
Percentage difference shows how two values compare. It is useful for prices, marks, and data comparison.
Can I use this calculator for school homework?
Yes, it is perfect for students. It is simple, free, and accurate.
Is a Percentage Calculator accurate?
Yes, it is fully accurate because it uses correct math formulas automatically.
Can I calculate discounts with this tool?
Yes, you can find discount percentage and final price within seconds.
Can I use the calculator on my phone?
Yes, the calculator is mobile-friendly and works on all devices.
Is it free to use?
Yes, this is a completely Free Percentage Calculator.
Can it calculate tax percentage?
Yes, just enter the amount and tax percentage to get the total.
Does it show steps?
Yes, the tool explains how the answer is calculated to help students learn.
Final Thoughts on the Percentage Calculator
A Percentage Calculator is one of the most helpful tools you can use in daily life. It saves time, prevents mistakes, and makes percentage problems simple for everyone. Whether you are a student, worker, business owner, or shopper, this tool helps you find the right answer fast.
You don’t need to remember formulas or do long calculations. Just enter your numbers and let the calculator do the work.
Try our Online Percentage Calculator now and see how easy math can be.
Thank you for reading this post, don't forget to subscribe!